
## Color Me Confused: Navigating the World of Color-Coded Maps in Business Analyst
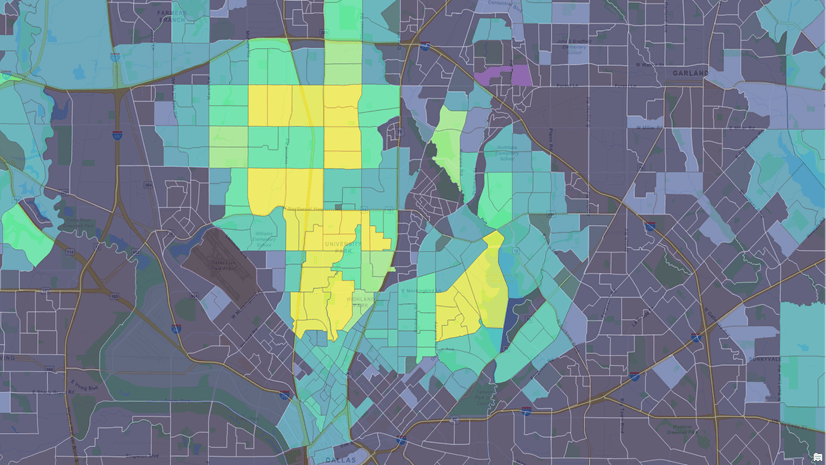
You’ve painstakingly crafted a brilliant map in Business Analyst Pro, a vibrant tapestry of data visualized through strategically chosen hues. You zoom in on crucial hotspots, track trends across regions, and present your findings with confidence. But then, you hit a snag. Sharing your masterpiece with the team, you realize their Web App experience is… lacking. The colors seem washed out, the legend doesn’t translate, and the once-clear message becomes muddled.
Sound familiar?
Color-coded maps are a powerful tool, but navigating their complexities across different Esri platforms can be tricky. Don’t worry, fellow spatial sleuths! In this article, we’re diving deep into the nuances of color mapping in Business Analyst Pro vs. the Web App, equipping you with the knowledge to create stunning visuals that truly shine, no matter where they’re viewed.Gamifying Your Data: The Storytelling Aspect
When it comes to presenting data to your audience, a visually appealing map can be a powerful tool for engaging them and driving home your message. The use of color, shape, and size can be used effectively to tell a story with your data, capturing the attention of your players and stakeholders.
Business Analyst Pro and Business Analyst Web App both offer robust tools for creating color-coded maps, but there are key differences in how these tools are used and the level of customization available. In this section, we’ll explore the importance of visually appealing maps and how to use color, shape, and size effectively to tell a story with your data.
Using Color Effectively
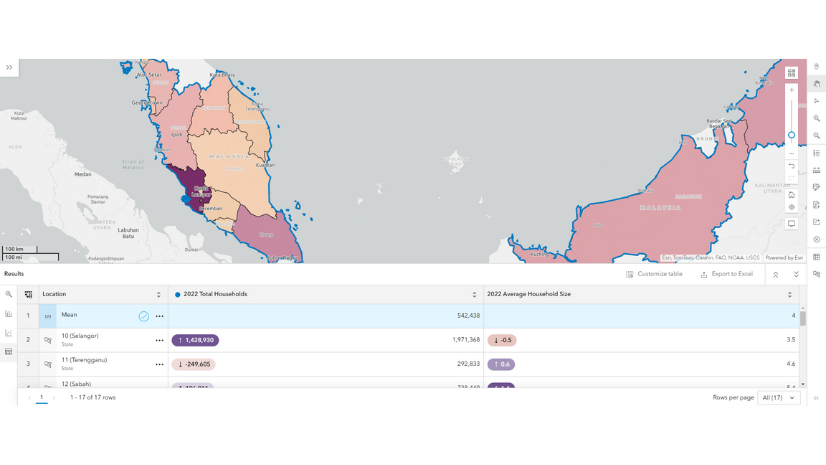
Color can be used to draw attention to specific areas of the map, highlight trends, and convey meaning. In Business Analyst Pro, users can select from a wide range of color schemes and customize the colors used for each variable. This level of customization allows users to create maps that are tailored to their specific needs and goals.
For example, a user might use different colors to represent different demographic groups, such as age or income. This can help to identify patterns and trends within the data and provide valuable insights for decision-making.
Using Shape and Size Effectively
Shape and size can also be used effectively to convey meaning and draw attention to specific areas of the map. In Business Analyst Pro, users can select from a range of different shapes and sizes, including circles, squares, and triangles. This allows users to create maps that are tailored to their specific needs and goals.
For example, a user might use different shapes to represent different types of data, such as population density or business revenue. This can help to identify patterns and trends within the data and provide valuable insights for decision-making.
Leveling Up: Advanced Features in Business Analyst Pro
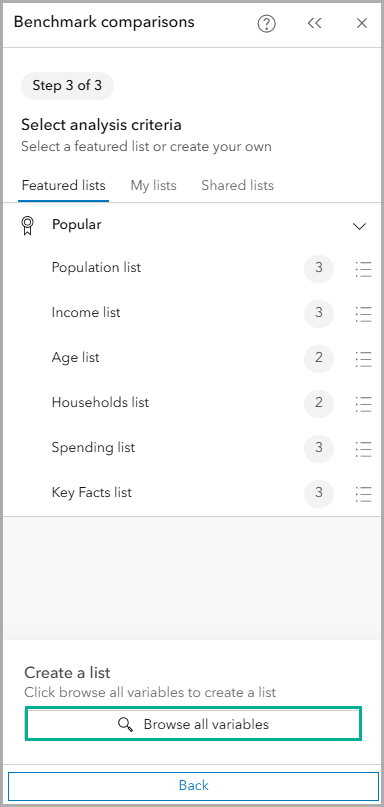
Business Analyst Pro offers a range of advanced features that can help users to unlock a deeper understanding of their target markets and territories. One of the key features of Business Analyst Pro is the ability to access site attributes for benchmark comparisons.
Pro-Level Power: Accessing Site Attributes
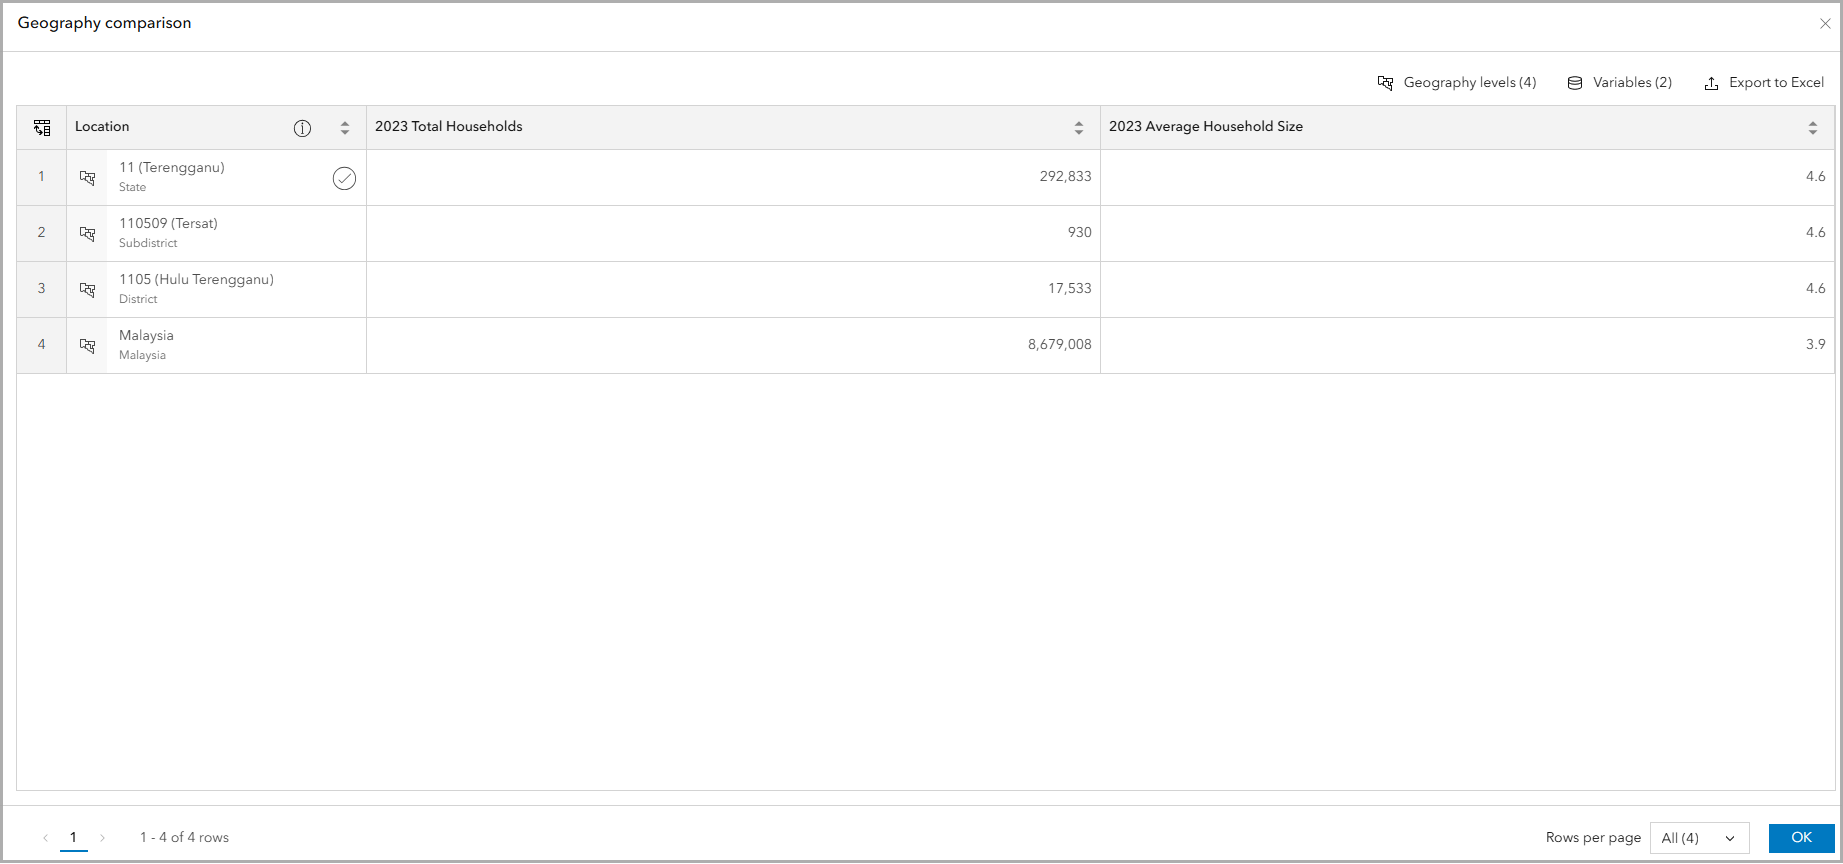
Site attributes are custom data that can be added to the map to provide additional context and insights. In Business Analyst Pro, users can access site attributes for benchmark comparisons, which allows them to compare sites based on a range of different variables.
For example, a user might use site attributes to compare the demographics of different areas, such as age or income. This can help to identify patterns and trends within the data and provide valuable insights for decision-making.
Pro Tips and Tricks: Optimizing Your Workflow
Business Analyst Pro offers a range of time-saving shortcuts and advanced techniques that can help users to streamline their workflow and maximize their efficiency. One of the key features of Business Analyst Pro is the ability to leverage the platform’s powerful geoprocessing tools and scripting capabilities.
For example, a user might use geoprocessing tools to automate complex tasks, such as data analysis or map creation. This can help to save time and increase productivity, allowing users to focus on more strategic tasks.
Choosing Your Weapon: Web App vs. Pro – What’s Right for You?
When it comes to choosing between Business Analyst Web App and Business Analyst Pro, there are several factors to consider. In this section, we’ll explore the key features and functionalities of each platform and help you to determine which is right for your specific needs and gaming strategy.
Weighing the Options: Feature Comparison
Business Analyst Web App and Business Analyst Pro both offer a range of features and functionalities, but there are key differences between the two platforms. In Business Analyst Web App, users can create color-coded maps and access site attributes for benchmark comparisons.
Business Analyst Pro, on the other hand, offers a range of advanced features, including geoprocessing tools and scripting capabilities. This allows users to create complex maps and automate tasks, which can help to streamline their workflow and increase productivity.
Accessibility and Collaboration: The Web Advantage
Business Analyst Web App is a cloud-based platform, which makes it ideal for team projects and collaborative game development. Users can access the platform from anywhere and share maps and data in real-time, which can help to facilitate collaboration and increase productivity.
Business Analyst Pro, on the other hand, is a desktop-based platform, which can make it more difficult to collaborate with others. However, users can still share maps and data through email or file transfer, which can help to facilitate collaboration and increase productivity.
Power and Customization: Pro’s Edge
Business Analyst Pro offers a range of advanced features and customization options, which can help users to create complex maps and automate tasks. One of the key features of Business Analyst Pro is the ability to access site attributes for benchmark comparisons.
Site Attributes for Benchmark Comparisons
Site attributes are custom data that can be added to the map to provide additional context and insights. In Business Analyst Pro, users can access site attributes for benchmark comparisons, which allows them to compare sites based on a range of different variables.
For example, a user might use site attributes to compare the demographics of different areas, such as age or income. This can help to identify patterns and trends within the data and provide valuable insights for decision-making.
Geoprocessing Tools and Scripting Capabilities
Business Analyst Pro offers a range of geoprocessing tools and scripting capabilities, which can help users to automate complex tasks and create complex maps. This can help to streamline the workflow and increase productivity, allowing users to focus on more strategic tasks.
For example, a user might use geoprocessing tools to automate data analysis or map creation. This can help to save time and increase productivity, allowing users to focus on more strategic tasks.
Conclusion
So, there you have it, a deeper dive into the nuanced world of color-coded maps in Esri’s Business Analyst Pro and Web App. We’ve explored how the strengths of each platform cater to different analytical needs. While Pro shines with its robust customization and advanced spatial analysis tools, Web App offers a streamlined, accessible experience for quick insights and collaborative sharing. The choice ultimately hinges on your specific project requirements, technical expertise, and budget considerations. No matter your chosen platform, remember that color-coded maps are more than just visual aids – they’re powerful storytelling tools. By harnessing the right colors, symbology, and data layers, you can unlock hidden patterns, reveal critical trends, and ultimately make more informed business decisions. As geospatial technology continues to evolve, we can expect even more sophisticated color-coding techniques and interactive mapping features, further empowering us to navigate the complexities of our world. Will you be ready to wield this power?